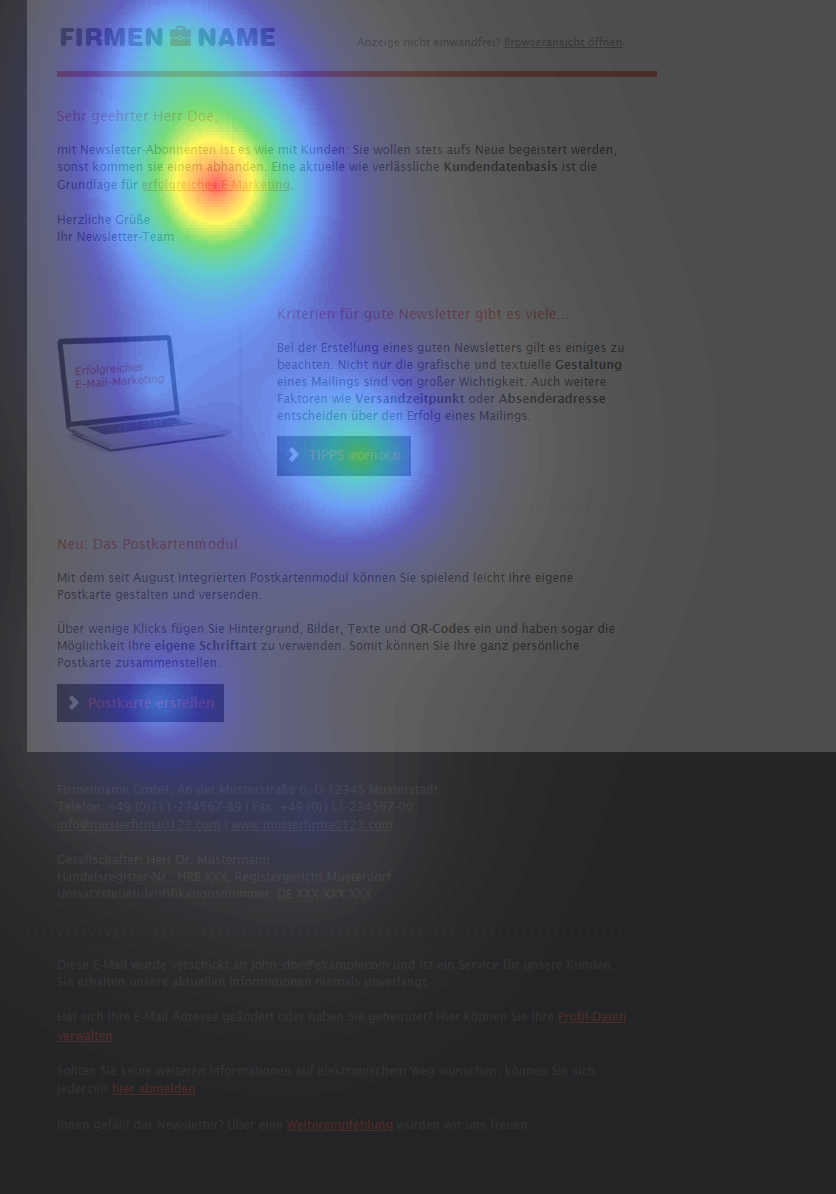
Email: Click and heat map
The clickmap and the heatmap show the spatial distribution of clicks within the newsletter. You can see at a glance which links attracted the most attention.
Clickmap
Open the email you want in the menu Statistics -> Email and select the third tab, the 'Clickmap' tab.
The percentage of a link shows its share of the total clicks of the newsletter. Hover over the link with the mouse to see more key figures.
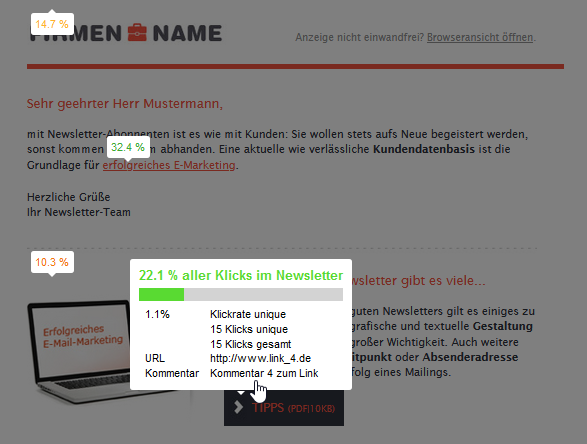
Above the clickmap, you can select a personalization to display the content of a specific recipient. This is useful, for example, when you use target group articles, so that you can look at the clickmap in all variants.
Note 1: The clickmap and the heatmap always show the behavior of all clickers, regardless of the selected personalization.
Note 2: The clickmap and the heatmap show the HTML part of your mailing and its click behavior. Clicks in the text part of the mailing are neither counted nor displayed here, because its spatial layout is usually completely different.
Heatmap
The heatmap puts even more focus on the spatial relationship between the links. You can see at a glance which area of your newsletter attracted the most attention. If neighboring links were clicked frequently, this results in a particularly strong hotspot. The links in the red area were clicked the most.