Email: Overview, open/click rate'Overview' tabThe overview summarizes the most important key figures and recipient reactions of your mailing. At the top right, you will find two quick links:
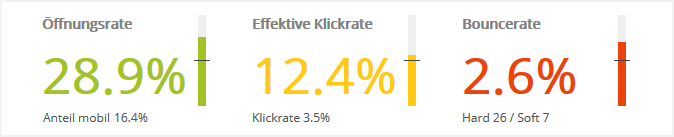
--> Open rate, click rate, bounce rateThe three most important key figures are shown in the colors red|yellow|green, depending on their success:
FAQ: When can I expect the first statistics data? Please give the statistics some time after sending your mailing. Experience shows that you can see a first trend about one hour after sending. The reason is that the open and click reactions of your subscribers and the bounce responses from the recipient side first have to come in and be evaluated. The statistics data is only truly representative a few days after sending. Note: The statistics always refer to the "historical" subscriber base at the time of sending. This makes them independent of subscribers who have since unsubscribed or been deleted. Internally, emma uses a copy of the subscriber data at that time, which was "frozen" specifically for the statistics evaluation. |
|||
--> DeliveriesThis section shows how successfully your mailing was sent.
In the center of the pie chart, you see the delivery rate of your mailing. This is the share of mailings actually sent compared with the planned number of recipients:
Reason 1) Some emails were not sent because they were filtered out before sending:
Reason 2) Some emails were sent but are undeliverable:
Tip: Click 'Deliveries' in the legend on the left to hide the large 'Deliveries' segment in the chart next to it and zoom the "small" segments to 360°. Their percentages also adjust to the new arrangement, so that you can easily compare the proportions of the remaining segments. --> Regional distributionThe map shows the regional distribution of mailing opens, which were determined automatically by geotargeting.
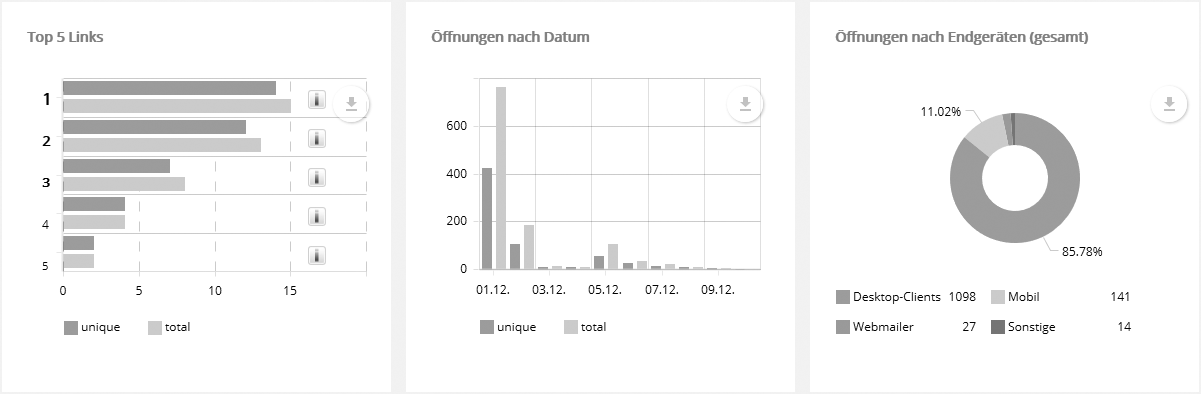
Click 'Full screen' to display the map in the entire window. Directly below the full screen link, you can use the download button to download the map graphic in various formats. Note: Although IP addresses are not generally tied to a specific location, the location can be determined in many cases from the known IP address ranges of internet providers, universities and similar institutions. Since regional dial-in nodes often have a fixed IP address pool, the method also works with dynamic IP assignment. For the assignment, emma uses a regularly updated local copy of a geotargeting database provided by an external service provider. --> Top 5 links + opens by date and deviceAs with every other chart, you can use the download button (top right corner) to download the displayed data as a graphic or Excel file. You can show or hide individual chart segments by clicking the corresponding item in the legend, e.g. 'Desktop clients' in the 'Opens by device' chart. The remaining segments are then zoomed to 360° and their percentages adjust to the new arrangement. This lets you directly compare the proportions of any segments.
--> InterestsIf you have assigned interests to the links in your mailing, the distribution of interests is displayed according to how often these links were clicked.
--> Trend of last mailingsHere the trend of the most recently sent mailings is shown for various key figures.
|
|||
|
|||
'Open rate' tabHere you will find additional options for evaluating the opens of your mailing in detail:
By the way: a mailing counts as opened when the recipient loads an image of the mailing or clicks a tracked link. For this purpose, emma links an invisible tracking pixel in the mailing as soon as automatic tracking is activated in the 'Advanced settings'. Measuring with a tracking pixel requires that the recipient allows images to be displayed in their inbox.
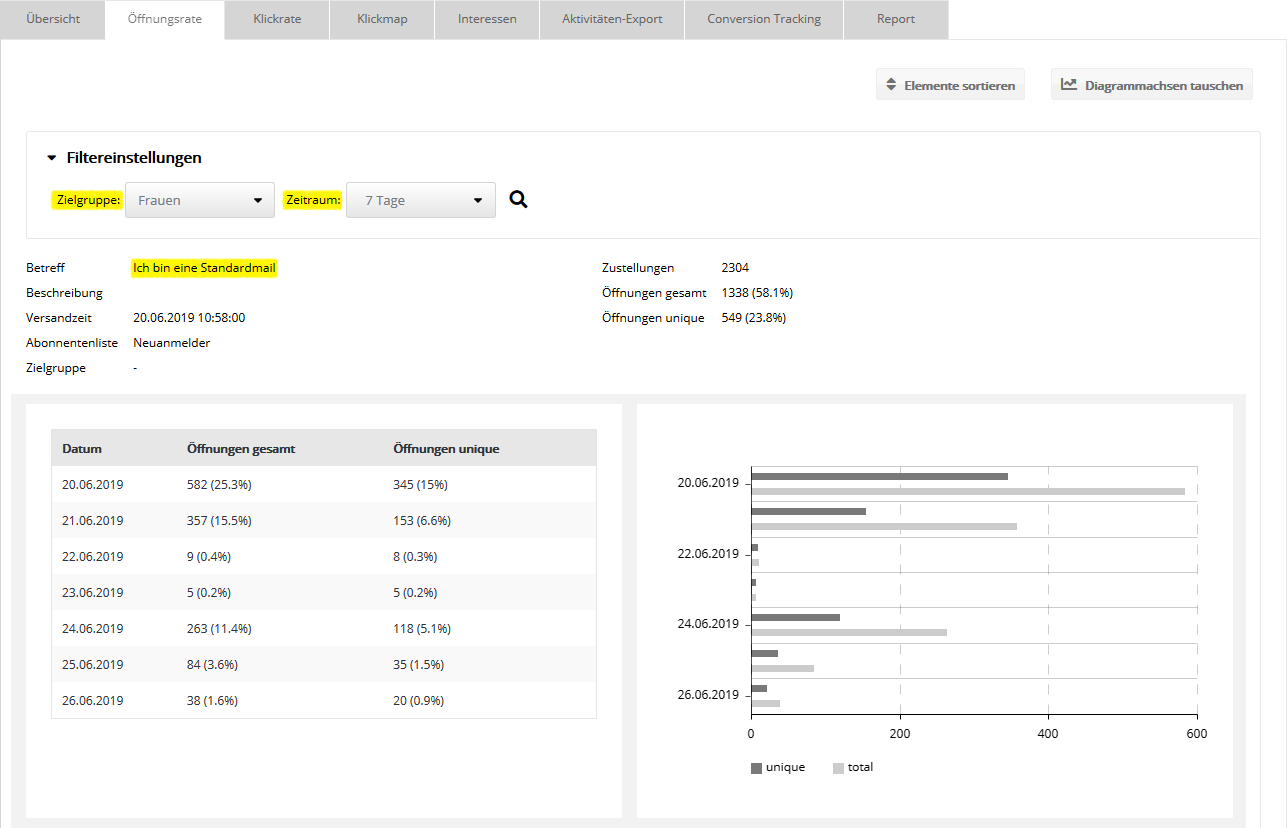
Filter settings for standard mailingsThe default setting is a period of 10 days from the start of sending. All displayed values refer to the selected target group and period filter. Depending on the selected filter, they can therefore be significantly lower than the unfiltered total values of the 'Overview' tab. The following screenshot shows the filtered open data of subscribers in the target group "Women" over a period of 7 days from the start of sending.
Filter settings for dialog and campaign mailingsThe filter options are the same as for standard mailings, see above. However, the default setting "10 days" does not refer to the first (oldest) 10 days from the start of sending, but to the 10 most recent days at the moment. These are much more interesting for dialog and campaign mailings, because there is a significant difference in sending compared with standard mailings:
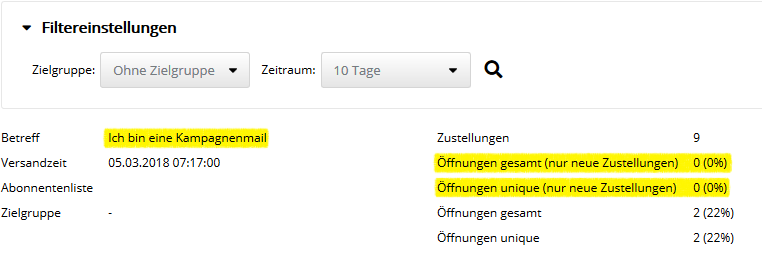
For this reason, for dialog and campaign mailings, the opens of emails that were delivered in the selected period are shown separately. The following screenshot serves as an "extreme example". It shows an old campaign mailing that has not been activated since 2018.
The 'Send time' shows the date on which the email was first activated. On the right side, the number of 'Deliveries' shows the total of all deliveries, regardless of the filter period. The displayed opens always refer to the set filter period, just as for standard mailings. For the two lines highlighted in yellow, there is an additional restriction:
Since the example mailing has not been activated since 2018, there were no new deliveries in the last 10 days. Nevertheless, there were still 2 opens in the last 10 days, "late bloomers", so to speak, who only opened the mailing years after delivery. An admittedly somewhat constructed example, but it will hopefully make the function clear.
Daily history of opens Here the 'Opens total' and 'Opens unique' are shown for each day in the selected period, i.e. each value refers to a single day. The "unique" evaluation also starts anew every day, i.e. it applies "locally" to that one day. Example: The daily table shows a period of 7 days. If the same subscriber opens the email every day, this results in one unique daily open for each of the 7 days. Based on the entire period, however, they still have only one single unique open. This is why the sum of unique opens in the daily table will often be greater than the unique number at the top of the summary or on the 'Overview' tab. 'Click rate' tabThis tab complements the 'Overview' tab in two essential points:
Every click by the recipient on a tracked link is counted. At the top right, you can use the 'Sort elements' link to change the order of the charts shown. Regarding the 'Filter settings', the same applies as already described in the previous section on the 'Open rate' tab. In the link list, "unique" really refers to this one link. This means that if a recipient clicked 10 different links in the mailing, this results in one unique link click for each of the 10 links in the link list. Based on the entire mailing, however, only one single unique click is included in the statistics. This is why the sum of unique clicks in the link list will often be greater than the unique number at the top of the summary or on the 'Overview' tab. The left column shows the Link ID for each link. It is used to uniquely identify the links in the activity export and as a parameter for the webservice functions for querying the link statistics. Note: The statistics always refer to the subscriber base at the moment of sending. This makes them independent of subscribers who have since unsubscribed or been deleted. Internally, emma uses a copy of the subscriber data at that time, which was "frozen" specifically for the statistics evaluation. This even lets you select, under 'Filter settings', a newly created target group to filter the statistics of an "old" mailing by new criteria. This option exists only in the statistics. Outside the statistics, target groups always filter the current subscriber data. |